‘Dollar per Foot‘ is the ERA of real estate. For you non-baseball fans, ERA stands for ‘Earned Run Average’ and it represents the number of runs a pitcher gives up per 9 inning game. For decades (if not centuries,) it represented the gold standards of comparative statistics in determining a pitcher’s effectiveness. But then the data guys invaded the game and found a good many metrics that do a better job of representing a pitcher’s value.
Just as ERA is (ok, was) to baseball, ‘Dollar per Foot’ is to real estate. Everybody talks about it: Realtors, architects, appraisers, developers, builders, even your local tax assessor. I would argue that it’s become something of a crutch. Like ERA, it’s an important number, but it is neither the be all nor the end all to discovering housing values.
There’s nothing we like at One South as much as the numbers. And it’s our conviction that as advocates for our clients, we must help people understand the numbers and the values behind them. When our clients better understand the tools available to help drive effective decision-making, everyone wins. Part of that is helping them understand ‘Dollar per Foot,’—as well as its limitations—and how that number should be applied to their situation.
So What is Price per Foot?
It is known by many names:
- Price per Foot
- Dollar per Foot
- Per Foot Price
- Square Foot Price
- PPF
- $/SF
All are supposed to convey that that the measurement is the ratio of the price of the home relative to its size—the price to the number of finished square feet in the subject home.
Unfinished space—not enclosed, unheated, things like attached garages or raw basements, don’t make it into the calculation. If an owner has renovated that garage into a fully functional theater, or 3rd floor into a teenager’s suite, then it is now considered finished and becomes part of that denominator.
$/SF and MLS
MLS is as much to blame as anyone for the overuse of $/SF as a measurement of value.
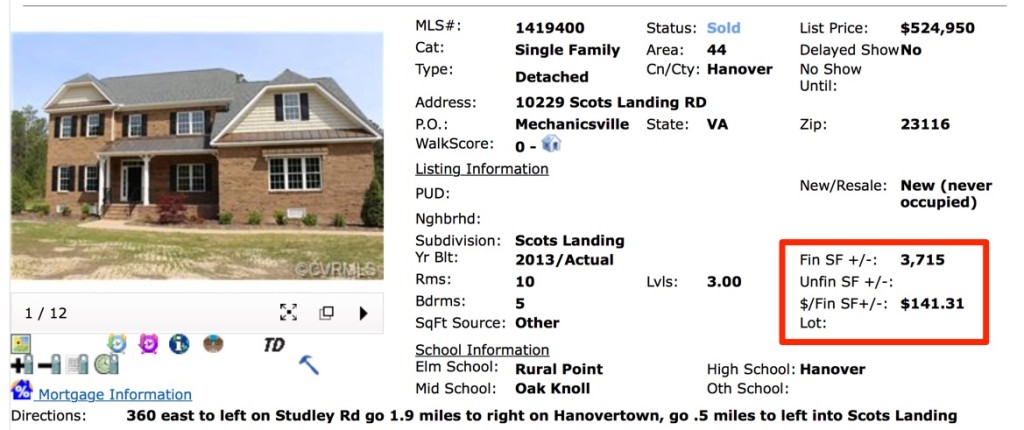
As you can see below, the MLS gives $/SF is its own separate field. Is it important? You bet, more so when used correctly, but certainly because it’s such a common part of the discussion around real estate.
But too often real estate professionals use $/SF too broadly and without any consideration for the many factors that can blur the results and render house-to-house comparisons nearly irrelevant.
So let’s talk about how this key metric is used both well and not so well.
Using $/SF to Compare Individual Homes
Probably the most common use for $/SF is in the comparison of two homes. In this case, $/SF can be either incredibly powerful or terribly misleading. It all depends on how the number is calculated.
Please note the following facts:
- $/SF is a ratio of price to FINISHED space. I can’t emphasize this enough. Homes with different balances of finished to unfinished spaces should not be compared using $/SF
- $/SF is more about the bricks, mortar, wood, finishes (the physical elements of the home) and assumes that the land value is a constant. Using $/SF to compare homes where the land value is appreciably different will not yield any worthwhile analysis.
- $/SF treats all construction types the same, regardless of materials used. Homes from different eras or using different construction methods/materials can’t be compared using $/SF.
So when does $/SF work? Only when you compare apples with apples.

Here’s the deal: if you’re going to use dollar per foot, make sure that the other characteristics of the property align, such as age, construction, lot characteristics, and so on. A buyer should not simply discount a cape cod plan with a first floor master bedroom as being ‘too expensive per foot’ when compared to the neighborhood’s average for colonial-styled two-story homes. Similarly, a seller assuming that their home with a finished 3rd floor will achieve the same $/SF as a home without the 3rd floor finished is also incorrect.
Ceilings, Floors and $/SF
One of the best ways to use dollar per foot is to build a range of highs and lows for a particular neighborhood.
Every neighborhood will have a ceiling and a floor for price per square foot. These data points can be critical when trying to establish value, especially if you’re dealing with properties that are special in any way.
MLS provides a function that allows Realtors to quickly identify neighborhood value characteristics.
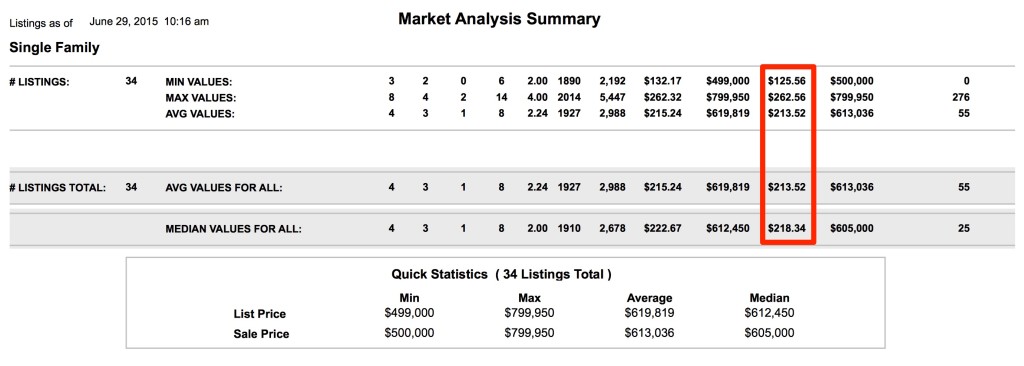
When you can look at a selection of homes within a narrow scope, this feature becomes even more valuable in establishing the limits for the values. Agents who know how to use this tool will provide better, more precise information to their clients.
Using $/SF as a Time Machine
Remember the Great Recession? Those four years between 2008-12? Real estate was crushed during this window. No financial market was spared from damage. And boy did it do a number on real estate values and the price adjustments needed.
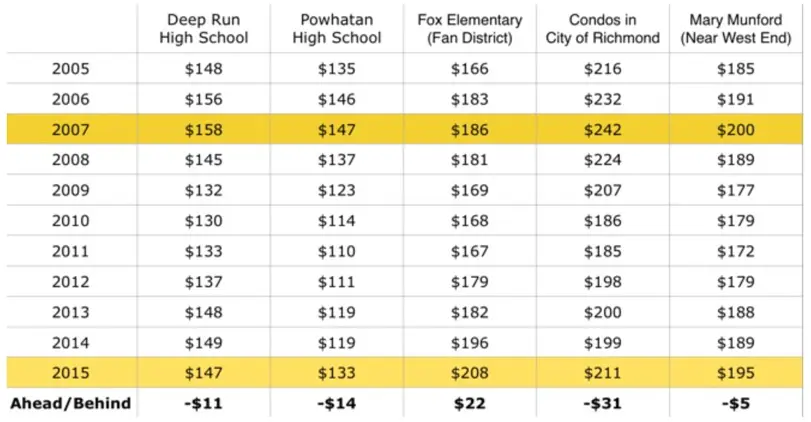
For those who executed a transaction in 2006-07, just before the bottom fell out, you probably lost a quick 20-30 percent of your value. You’re probably wondering how much of it you’ve gotten back. $/SF can help.
The chart above demonstrates that a yearly breakdown of $/SF can tell you about the relative health of different markets. Using the same geographic data but changing the time periods measured is a fantastic application of price per foot and can greatly improve decision making.
Using $/SF in Reverse
We often tell our clients to look for HIGH price per foot to find underpriced assets.
Wait … what??
In certain instances, price per foot values considered higher than the neighborhood averages may suggest that a property’s improvements are low, making it a prospect for an addition or lot split. Having a situation where the value of the land is at or near the value of the improvements often times means opportunity for the shrewd investor.
For example, it was pretty common decades ago for an owner to purchase an adjacent lot to provide additional privacy and security. These unimproved lots were later folded into the improved ones and became part of one package. But there’s an urgency to create more urban housing, with the search for buildable lots intensifying. Builders will pay a premium for an infill lot.
It’s also pretty common to see smaller ranches or colonial-styled home peppered among larger homes, especially in the neighborhoods built between 1930-60. If a neighborhood’s market values exceed construction costs, there might be opportunity to expand a home and create sizable value.
Simply by knowing how to use MLS to set these search parameters can prove to be very valuable, especially if you’re working with contractors/developers/flippers. When you create value for clients, you create loyal clients.
Summary
Price per foot might not be on such shaky ground if it hadn’t been used so relentlessly, especially when inappropriate.
Data of every stripe is only going to become more and more accessible. So we need to remember that access and analytics are not the same thing. The creation of new and complicated statistics is easier than ever before, but it does not necessarily mean they are relevant, accurate or applied correctly.
At the end of the day, the $/SF statistic is one of many, but it certainly doesn’t tell the whole story. Do yourself a favor and understand how to apply price per foot before making a decision.
